Nothing like walking in Monday morning and the first thing you here is 'Hey Chris, any idea why TFS is down?'
The first thing I do like anyone is attempt to log into the web interface to see if I'm getting a HTTP error, .NET error, or something else. I received none, in fact I didn't even get the pop up for authentication (I'm off domain) however the server never responded with an error. We investigated the application logs on the application tier and nothing was out of the ordinary. Launching the TFS Administration Console and SQL Profiler we found that it couldn't get a response to a command from the database (it would connect, attempt a query, but would never get a response in the proper time and would fail gracefully).
I was able to connect to the database and perform some system level queries on the actual database server. It was pushing 50-60% CPU continuously from sqlserver.exe in the task manager. Commands were slow, but for the most part the server was responsive as were the various databases we were querying against.
Digging deep into my little knowledge of DMVs I was able to locate a query to show me any resource contention that may be happening. Interestingly enough, it showed that I had a few RESOURCE_SEMAPHORE locks that had been hanging out for many hours on the TfsConfiguration database with clearly no intentions to let go.
Here's where it got a little interesting. Look at the image below (you'll need to click on it to actually see it) which is a screen cap of the output from the above query. Notice the wait_durations and database? The interesting thing is, once we rebooted, I've not seen any entries in this table for longer than a few seconds.

The culprit seemed to be the SPID 110, but... just as I was attempting to potentially kill these SPIDs management made the call to reboot the server. In the past it had worked, so I completely understand, especially when it was killing productivity and we had everything running through it (Release Management, Test Management, VC, Work items, the whole kit and caboodle). However, upon rebooting we did see that all locks were removed and did not show back up.
The challenge we have is being able to recreate the situation. It usually only happens every 4-6 weeks, no direct pattern at this point, but that's what infrastructure has reported. Their request to us was how to be more preemptive to this problem. Since I'm not 100% that what I found is the issue, I don't have a firm answer but I had them run the query provided above through the monitoring tool and if we see wait times above ~5 minutes, to set of an alarm to make sure TFS is still responding. We don't have causation, but there is at least some correlation.
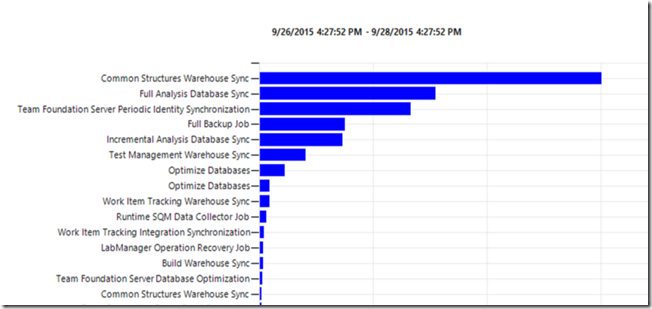
It's not over though. I wanted to know more. I headed on over to the tfs/_oi page to see if anything stood out. It did. The graph below shows us the job timing of all the TFS jobs in the server. At the top, we see Common Structures Warehouse Sync.
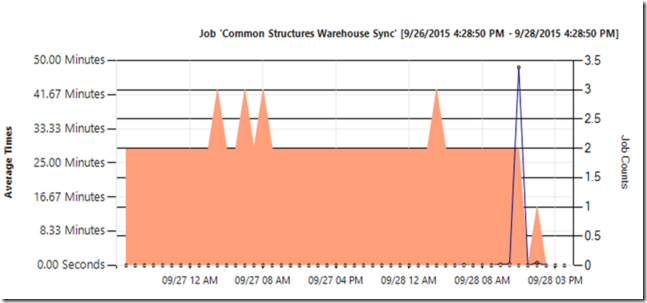
This seemed odd, normally this job is pretty quick as there isn't a lot of data that goes along with it in comparison to so many other tables. We dug deeper into the details and found the execution times and queuing seemed to be way off.

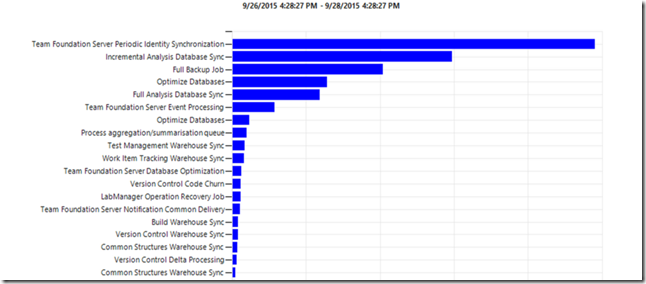
I went to our own (company) TFS server to see if we had the same issue, I found that the timings were way different, and as suspected the Common Structures Warehouse Sync Service took almost no time at all execute.
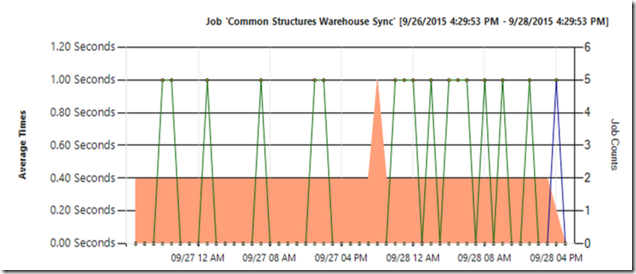
And the drill down into the details we see that as suspected, this job should take a minimal amount of resources.

As to why this is happening, I'm not sure. I've sent through a colleague to get answered by the product team. In the meantime, we are simply seeing if we can find a relationship between the locking we are seeing and TFS not responding. I'll write a follow up post if I get more information. Until then, monitor and reboot! :)

